Report guide

What Each Report Means

License Log Analysis turns license manager logs into practical reports for engineering software usage, denials, sessions, users, features, vendors, and utilization. This page explains what each report shows and how to use it without needing to read raw log lines manually.

Use this guide when reviewing FlexLM, FlexNet Publisher, RLM, Sentinel RMS, DSLS, Altair ALM, or LM-X license activity. The goal is simple: understand what happened, where demand was high, where users were denied, and which license areas deserve a closer look.

Overview Report

The Overview report is the first place to look after a log is parsed. It summarizes the main activity in the file and gives a quick sense of the log quality, date range, usage volume, and denial count.

Use this report to

  • Confirm the log was parsed successfully.
  • Check the analyzed date range.
  • See how many completed sessions were found.
  • Review total usage hours, peak concurrent usage, users, features, vendors, and denials.
  • Check parser details such as raw lines, matched events, unmatched events, unique users, and unique workstations.

Interpretation tip: Use the Overview report as a health check before making decisions. If the date range is wrong, the event count is unexpectedly low, or parsing health looks suspicious, review the input log before relying on deeper reports.
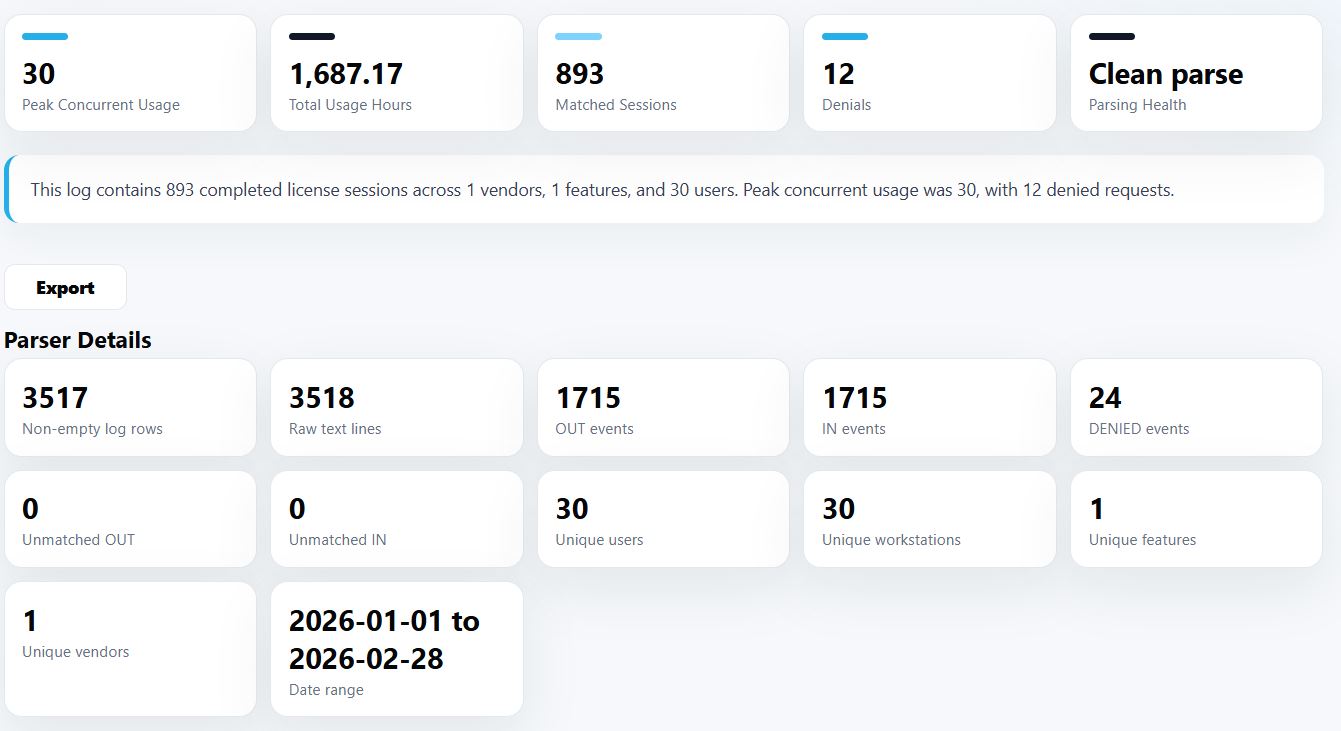
Overview report showing license sessions, usage hours, denials, users, features, vendors, date range, parser details, and parsing health

Concurrent Usage Report

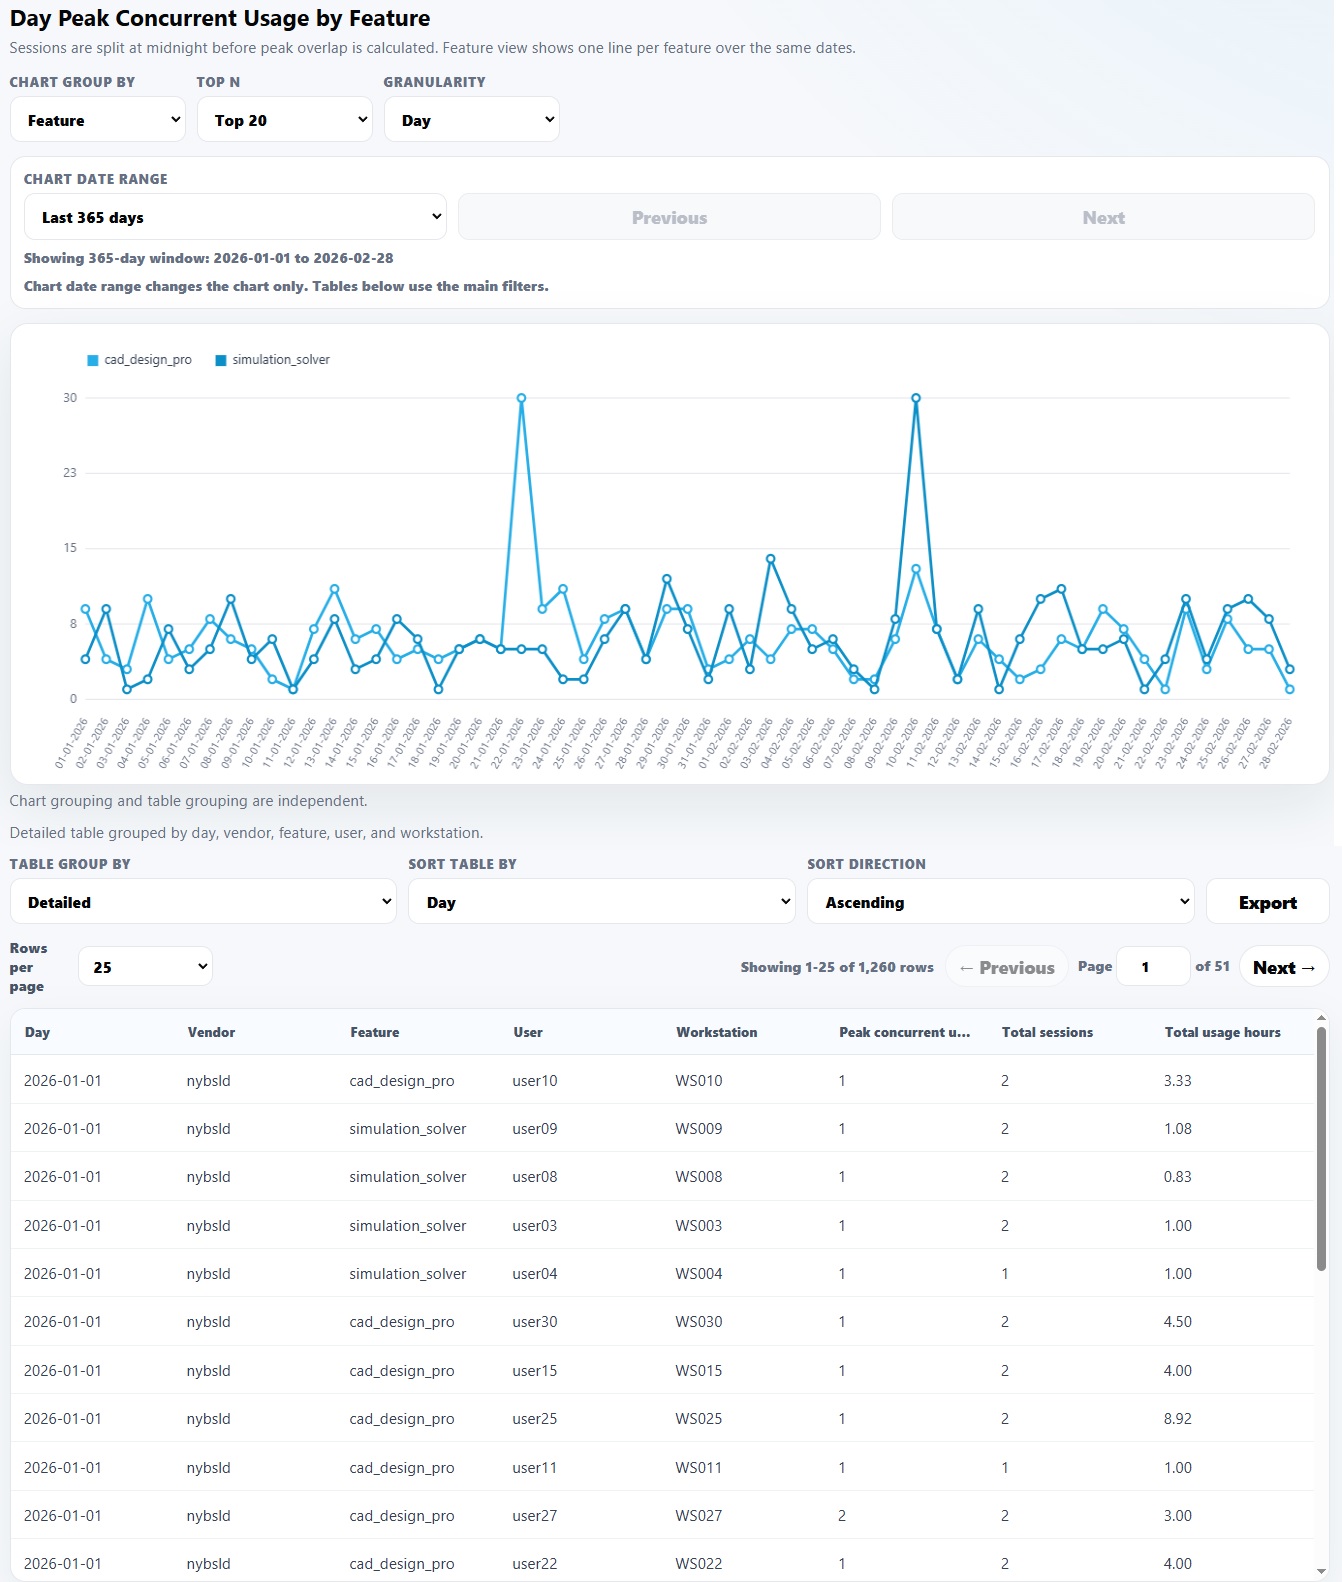
The Concurrent Usage report shows how many licenses were in use at the same time. This is one of the most important reports for floating license environments because it helps identify peak demand, capacity pressure, and possible overbuying or underbuying.

Use this report to

  • Find peak concurrent license usage.
  • Compare demand by feature, vendor, user, workstation, or all activity.
  • See when license usage was highest.
  • Understand whether high usage happened once or repeatedly.
  • Support renewal, capacity planning, and license optimization discussions.

Main controls

  • Group by: All, Feature, Vendor, User, or Workstation. This controls how the chart legend is separated.
  • Granularity: Day, Week, Month, Quarter, or Year. This aggregates the maximum concurrent usage within each selected time bucket.
  • Date range: Last 7 days, Last month, Last 3 months, Last 6 months, Show all, or a custom date range.

Interpretation tip: Do not look only at the highest peak. A one-time spike may not justify more licenses, while repeated peaks during normal working hours may indicate real capacity pressure.

Concurrent usage chart showing peak concurrent license usage over time

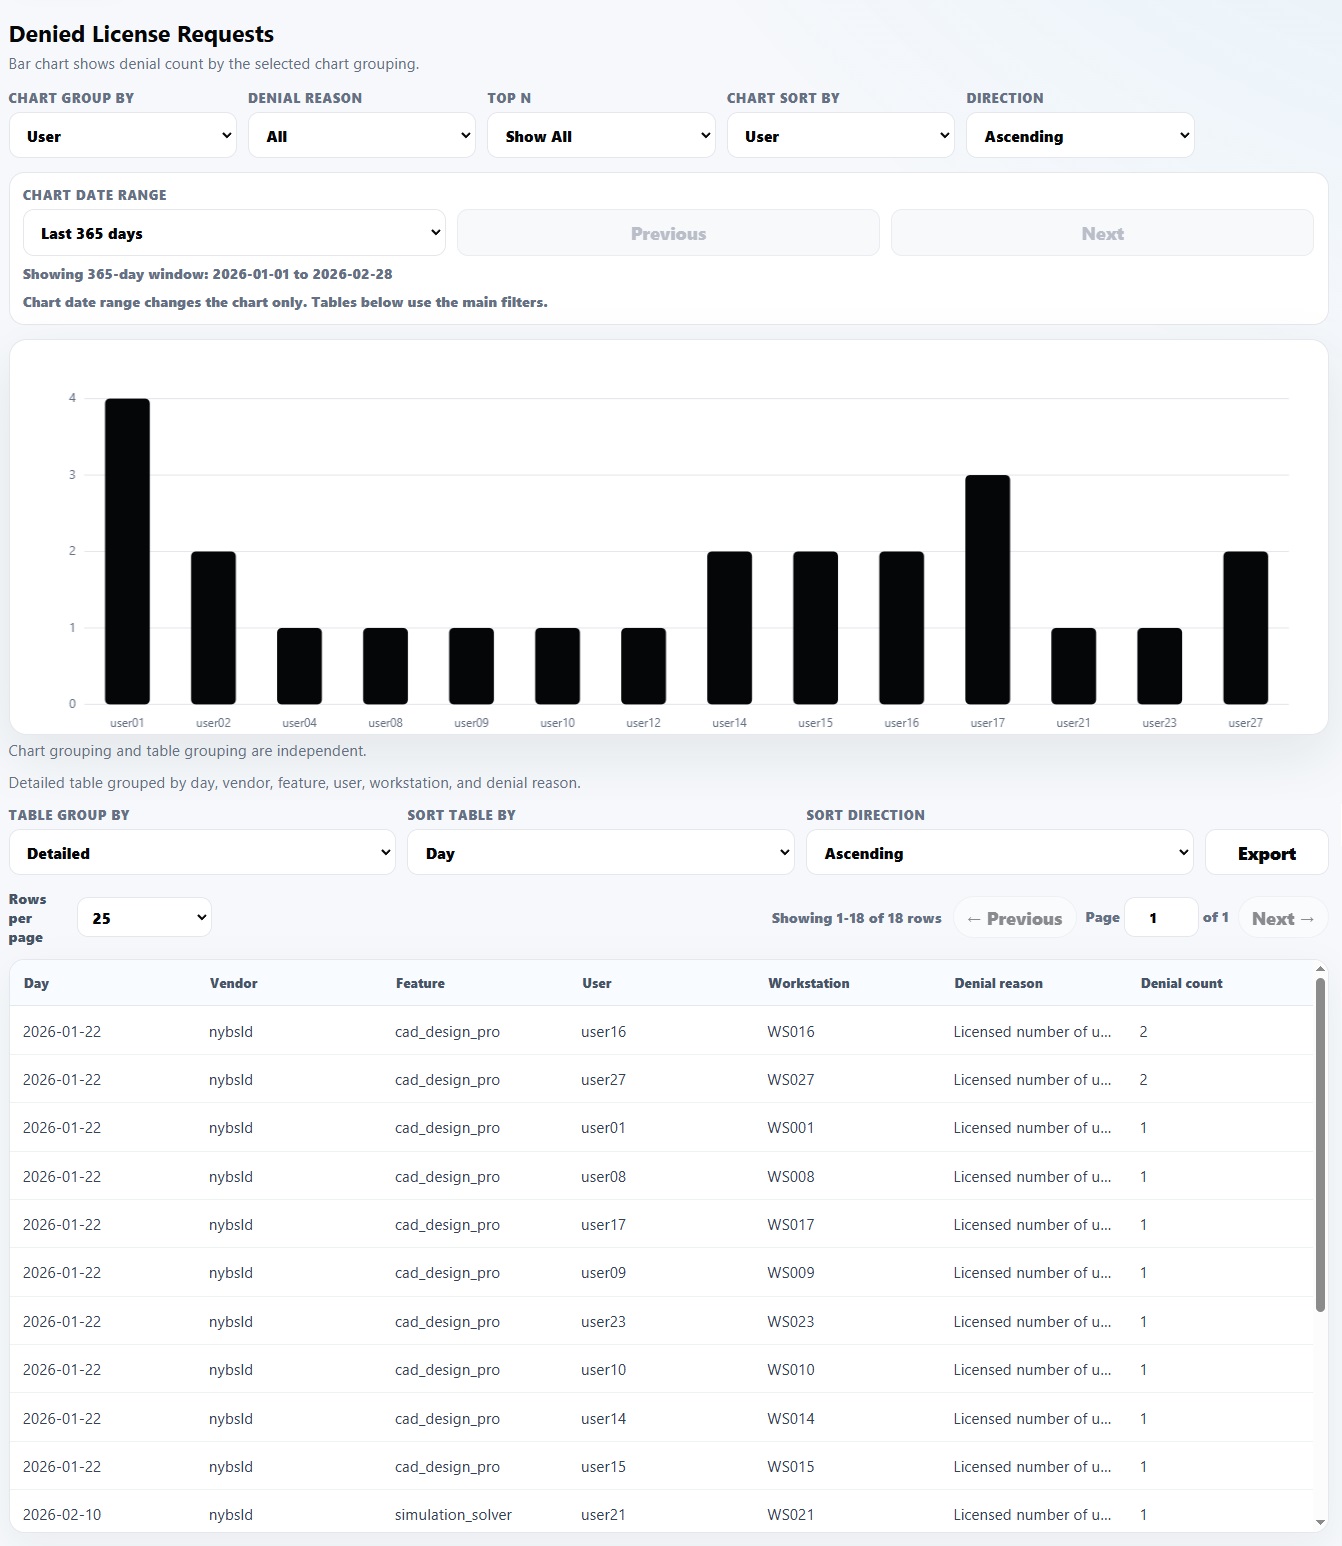
Denials Report

The Denials report shows license requests that were rejected or could not be served. It helps identify where users could not access a feature, when demand exceeded availability, or where configuration issues may exist.

Use this report to

  • Find which users, features, vendors, or workstations had the most denials.
  • Understand when denials happened.
  • Review denial reasons where available.
  • Separate real capacity issues from configuration or entitlement problems.
  • Support troubleshooting before buying additional licenses.

Main controls

  • Group by: User, Feature, Vendor, Workstation, Denial Reason, Day, Week, Month, Quarter, or Year. This controls the X axis of the chart.
  • Denial reason: Filters the report to a specific denial reason when denial reasons are available in the log.
  • Top N: Shows only the top 5, 10, 20, or all grouped results.
  • Sort by: Sorts by fields such as user, workstation, feature, vendor, denial reason, denial count, day, week, month, quarter, or year.
  • Direction: Sort ascending or descending.
  • Date range: Last 7 days, Last month, Last 3 months, Last 6 months, Show all, or a custom date range.

Interpretation tip: A denial does not always mean you need more licenses. Denials can also come from expired features, wrong license paths, version mismatches, options file rules, or users requesting a feature they are not entitled to use.

Denials report showing denied license requests by user

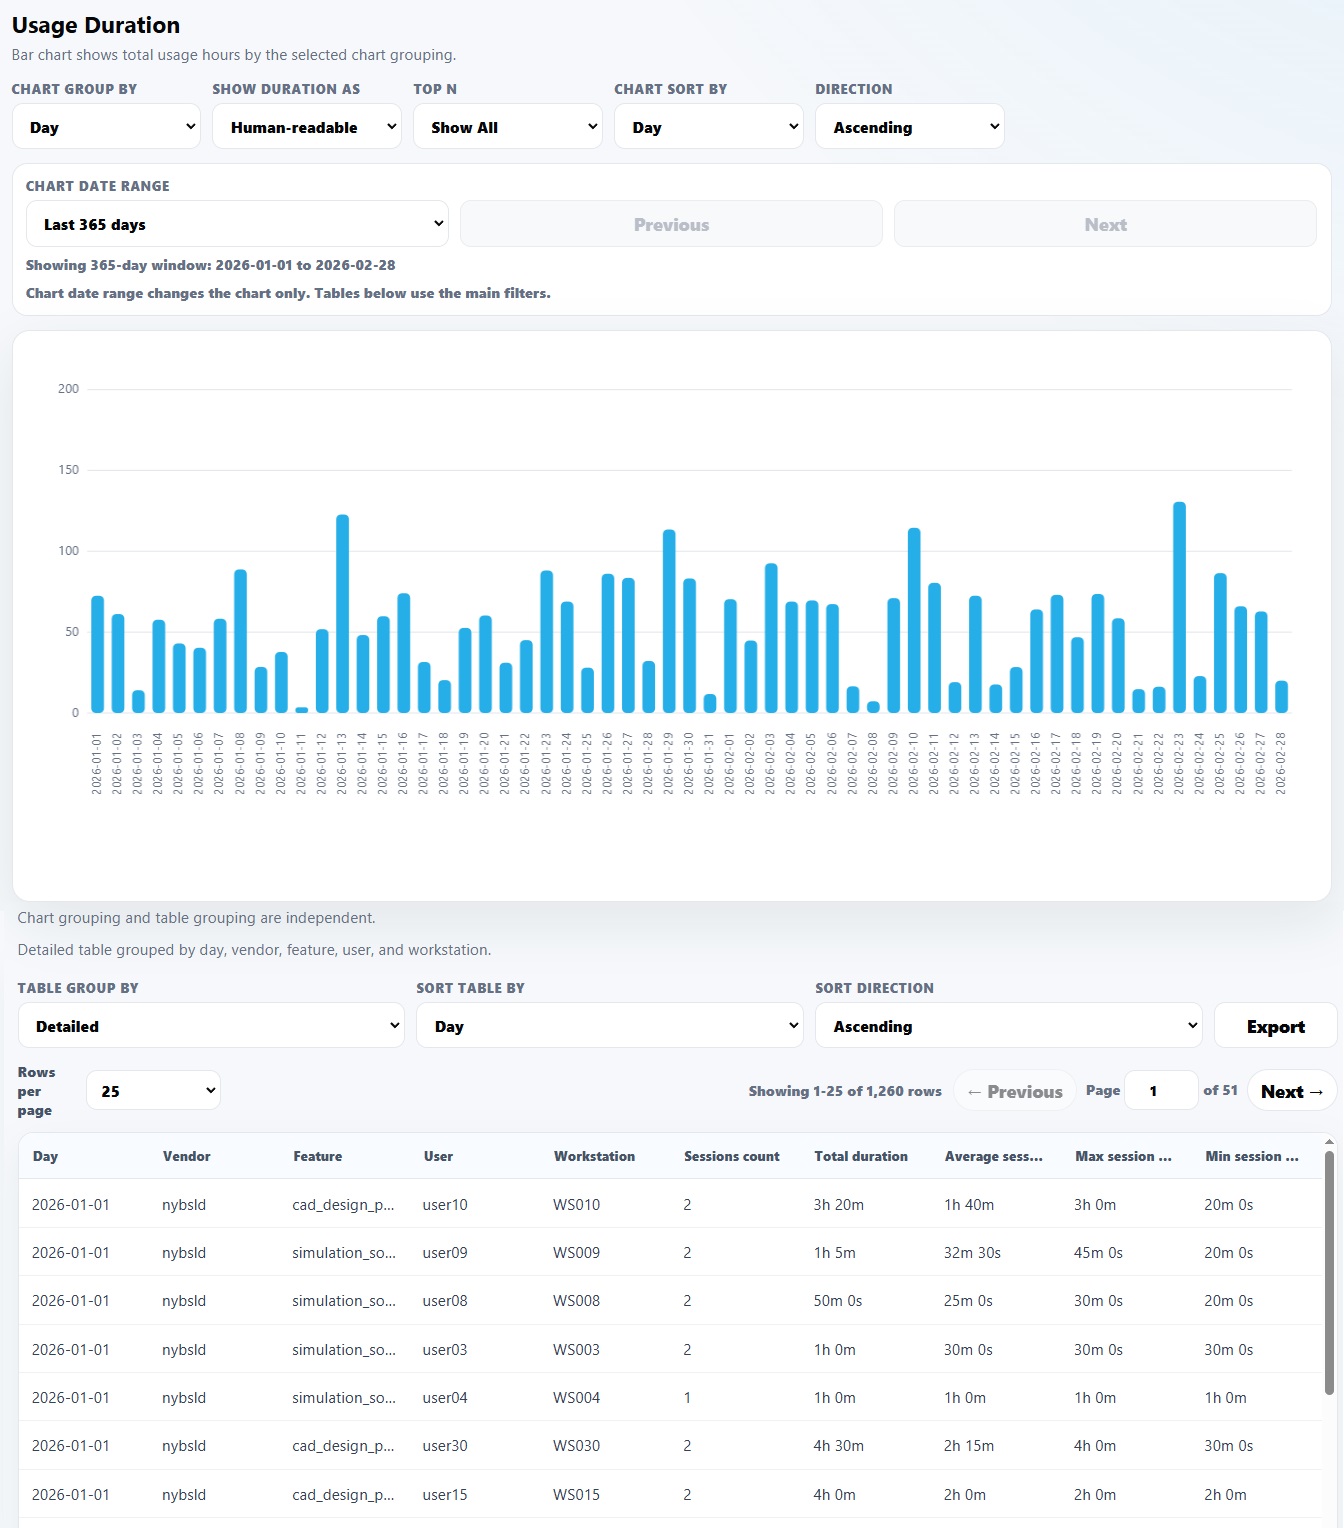
Usage Duration Report

The Usage Duration report measures how long licenses were held. It helps identify heavy users, long sessions, overnight usage, unusual license behavior, and features that consume the most active license time.

Use this report to

  • See total license usage duration by user, feature, vendor, workstation, or time period.
  • Find long-running sessions or unusual usage patterns.
  • Compare usage duration across features or teams.
  • Support idle timeout, harvesting, and optimization reviews.
  • Understand whether licenses are briefly checked out often or held for long periods.

Main controls

  • Group by: User, Feature, Vendor, Workstation, Day, Week, Month, Quarter, or Year. This controls the X axis of the chart.
  • Top N: Shows only the top 5, 10, 20, or all grouped results.
  • Sort by: Sorts by user, workstation, feature, vendor, day, week, month, quarter, year, total duration, session count, average session duration, maximum session duration, or minimum session duration.
  • Direction: Sort ascending or descending.
  • Date range: Last 7 days, Last month, Last 3 months, Last 6 months, Show all, or a custom date range.

Interpretation tip: Long sessions are not automatically waste. They may represent valid engineering work, simulations, batch jobs, or overnight processing. Review long sessions in business context before taking action.

Usage duration report showing total license usage duration over time

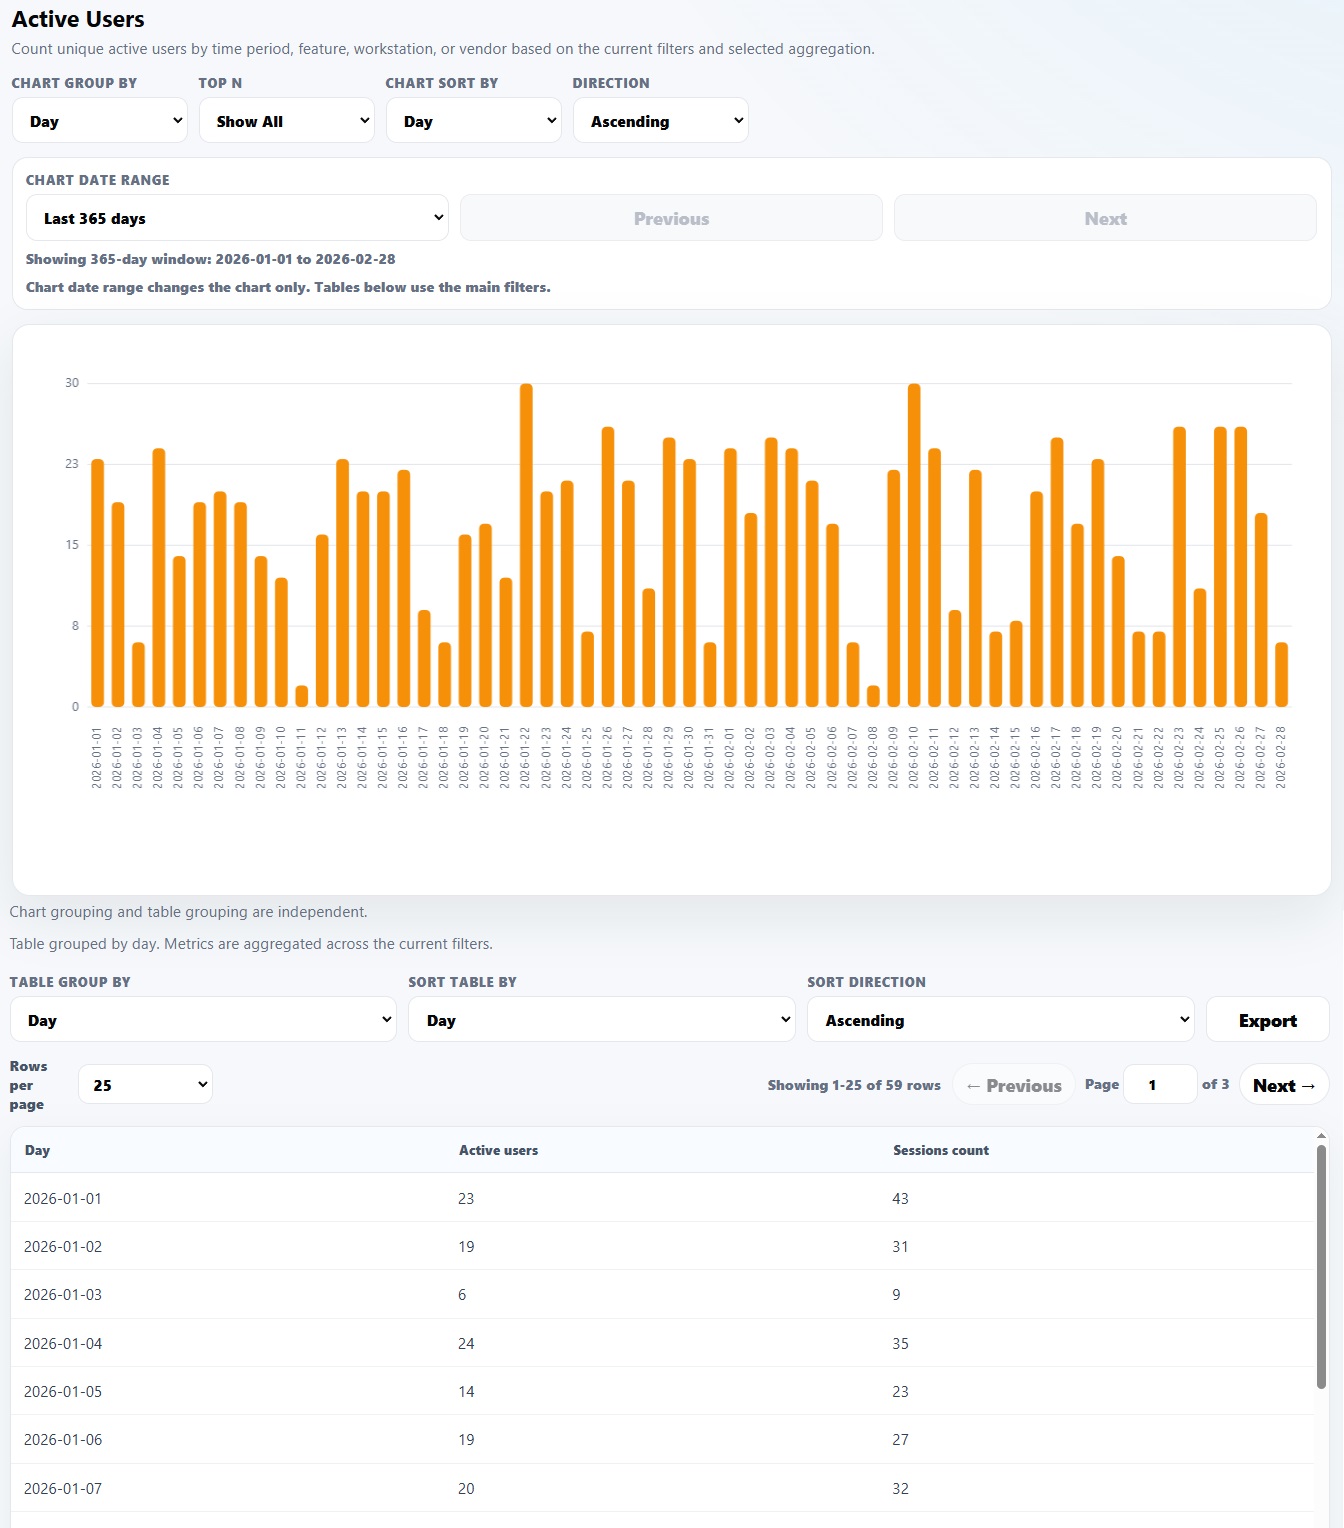
Active Users Report

The Active Users report shows how many unique users were active. It helps teams understand adoption, real user demand, and whether a license pool is used by many people or only a small group.

Use this report to

  • Measure unique active users.
  • Compare adoption by feature, vendor, workstation, or time period.
  • Identify tools used by only a small number of people.
  • Understand whether demand is broad or concentrated.
  • Support showback, chargeback, renewal, and internal planning discussions.

Main controls

  • Group by: User, Feature, Vendor, Workstation, Day, Week, Month, Quarter, or Year. This controls the X axis of the chart.
  • Top N: Shows only the top 5, 10, 20, or all grouped results.
  • Sort by: Sorts by user, workstation, feature, vendor, day, week, month, quarter, year, active users, or session count.
  • Direction: Sort ascending or descending.
  • Date range: Last 7 days, Last month, Last 3 months, Last 6 months, Show all, or a custom date range.

Interpretation tip: Active user count is useful for adoption analysis, but it should not be confused with concurrent usage. Thirty active users over a month does not mean thirty licenses were needed at the same time.

Active users report showing distinct license users over time

License Utilization Report

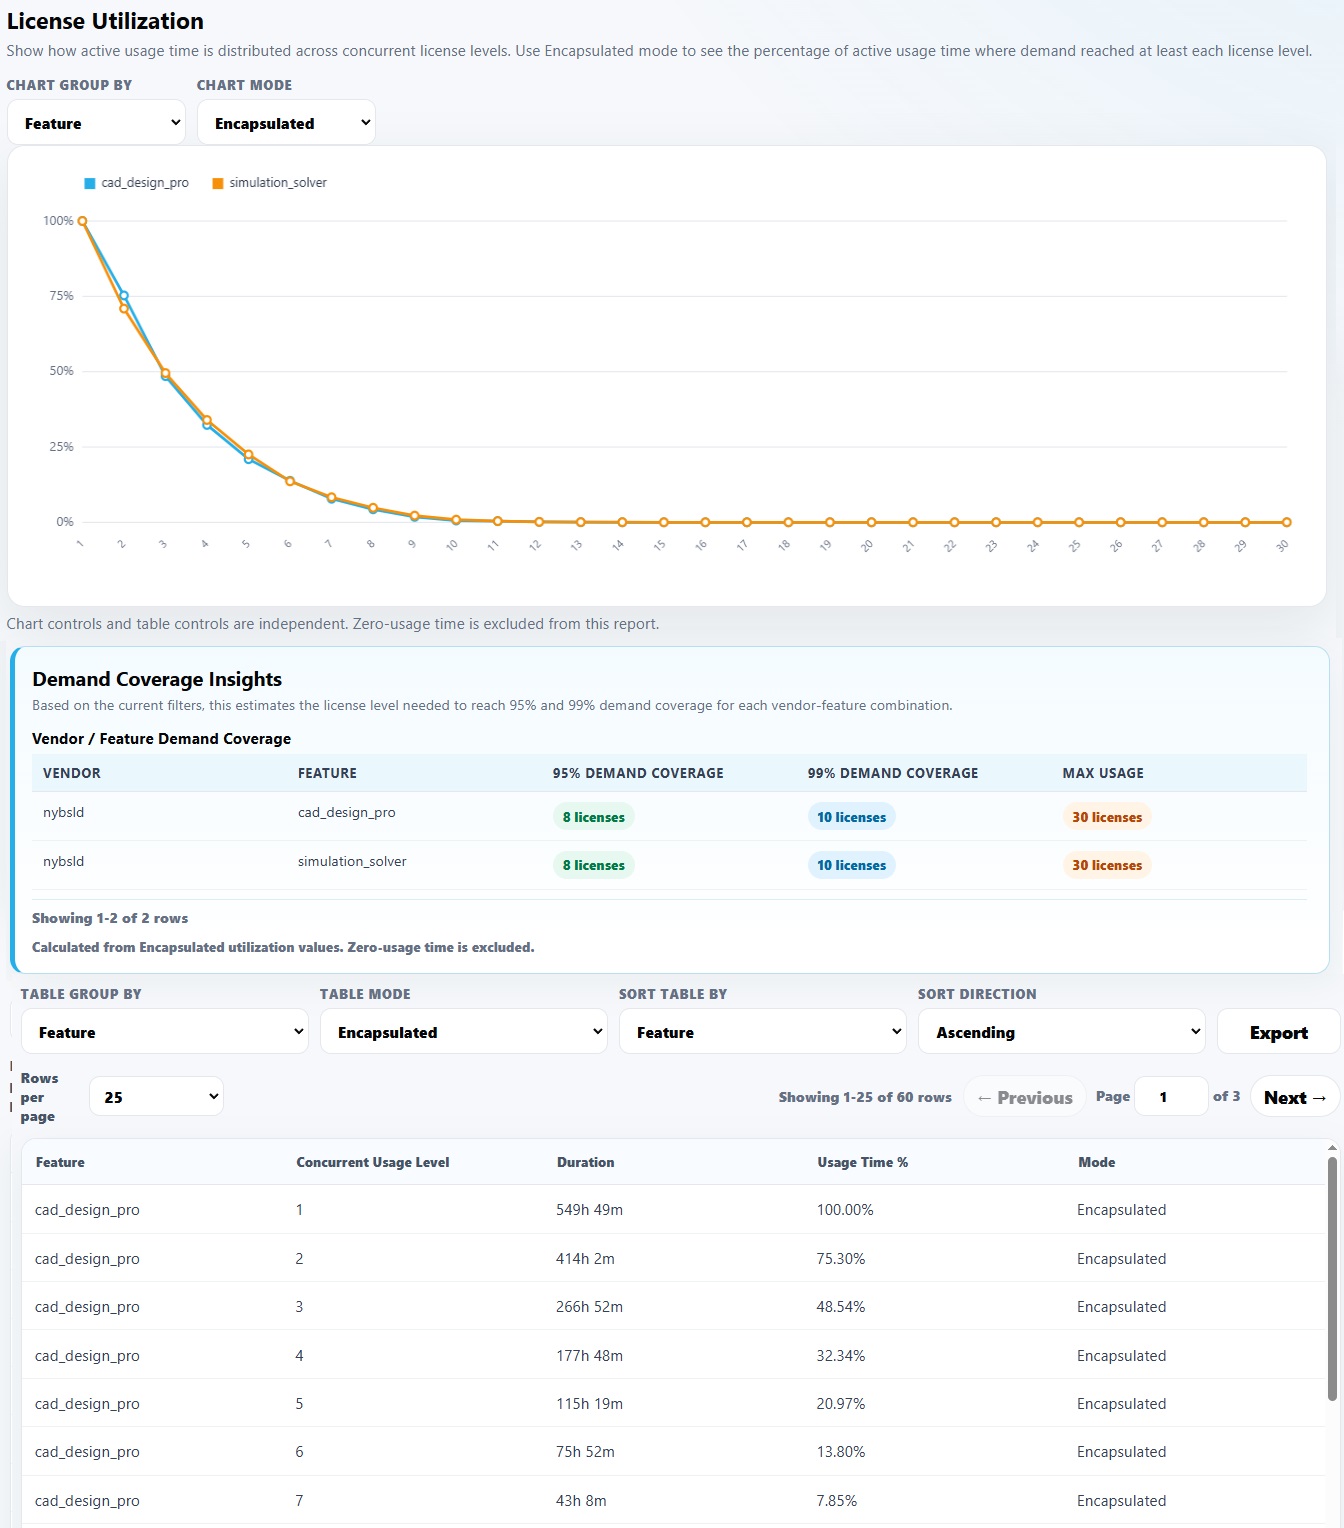
The License Utilization report shows how active usage time is distributed across concurrent license levels. It helps explain how often demand reached each license level and supports practical capacity planning.

Use this report to

  • See how much active usage time was spent at each concurrent license level.
  • Understand whether maximum usage was common or rare.
  • Estimate the license level needed to cover most demand.
  • Review 95 percent and 99 percent demand coverage estimates.
  • Support renewal planning and optimization discussions.

Main controls

  • Group by: Feature, Vendor, or All. This controls how the chart legend is separated.
  • Chart mode: Encapsulated or Not Encapsulated.
  • Encapsulated mode shows the percentage of active usage time where demand reached at least each license level.
  • Not Encapsulated mode shows the percentage of active usage time spent at each specific concurrent usage level.

Demand coverage explanation: The Demand Coverage Insights table estimates the license level needed to cover 95 percent and 99 percent of observed active demand for each vendor-feature combination. For example, a feature may have a max usage of 30 licenses but a 99 percent demand coverage level of 10 licenses. That means the highest peak existed, but most active demand stayed at or below a lower level.

Interpretation tip: This report is useful because maximum usage alone can be misleading. A rare peak of 30 licenses is different from sustained demand near 30 licenses every day.

License utilization report showing demand coverage and percentage of time spent at concurrent license levels

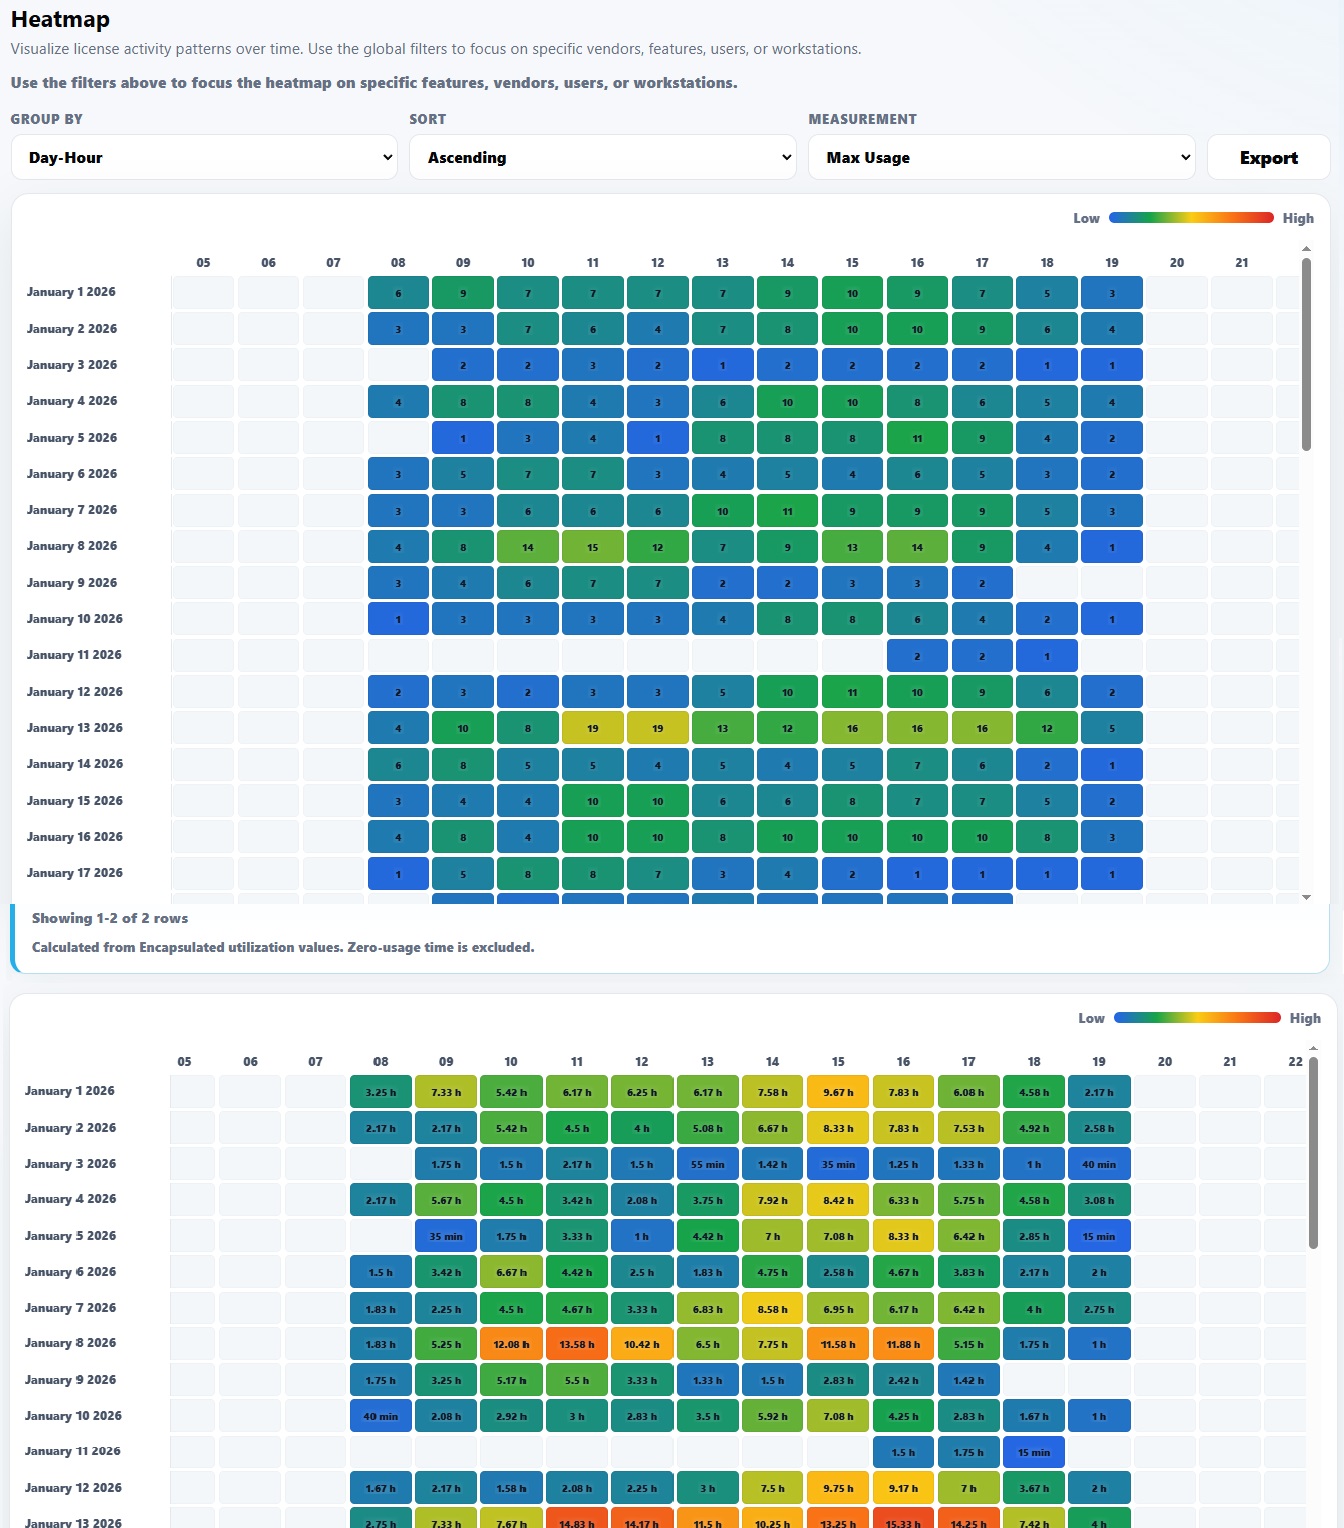
Heatmap Report

The Heatmap report visualizes license activity patterns over time. It makes busy periods, quiet periods, recurring demand, and unusual spikes easier to spot.

Use this report to

  • Identify busy hours, days, weeks, or months.
  • Find recurring demand patterns.
  • Compare workday, weekend, and after-hours behavior.
  • Spot possible batch jobs, automated processes, or scheduled workloads.
  • Review when denials or high usage occur most often.

Main controls

  • Group by: Day-Hour, Week-Day, Month-Day, Year-Month, Year-Week, or Year-Day. This controls the heatmap structure.
  • Measurement: Max Usage, Total Duration, or Denials.
  • Direction: Sort ascending or descending.
  • Color scale: Low values are shown in blue, and high values are shown in red.

Interpretation tip: The heatmap is especially useful when users say licenses are unavailable sometimes, but the exact pattern is unclear. It can show whether the issue happens every morning, at month end, on specific weekdays, or during scheduled workloads.

Heatmap report showing license activity patterns by date and hour

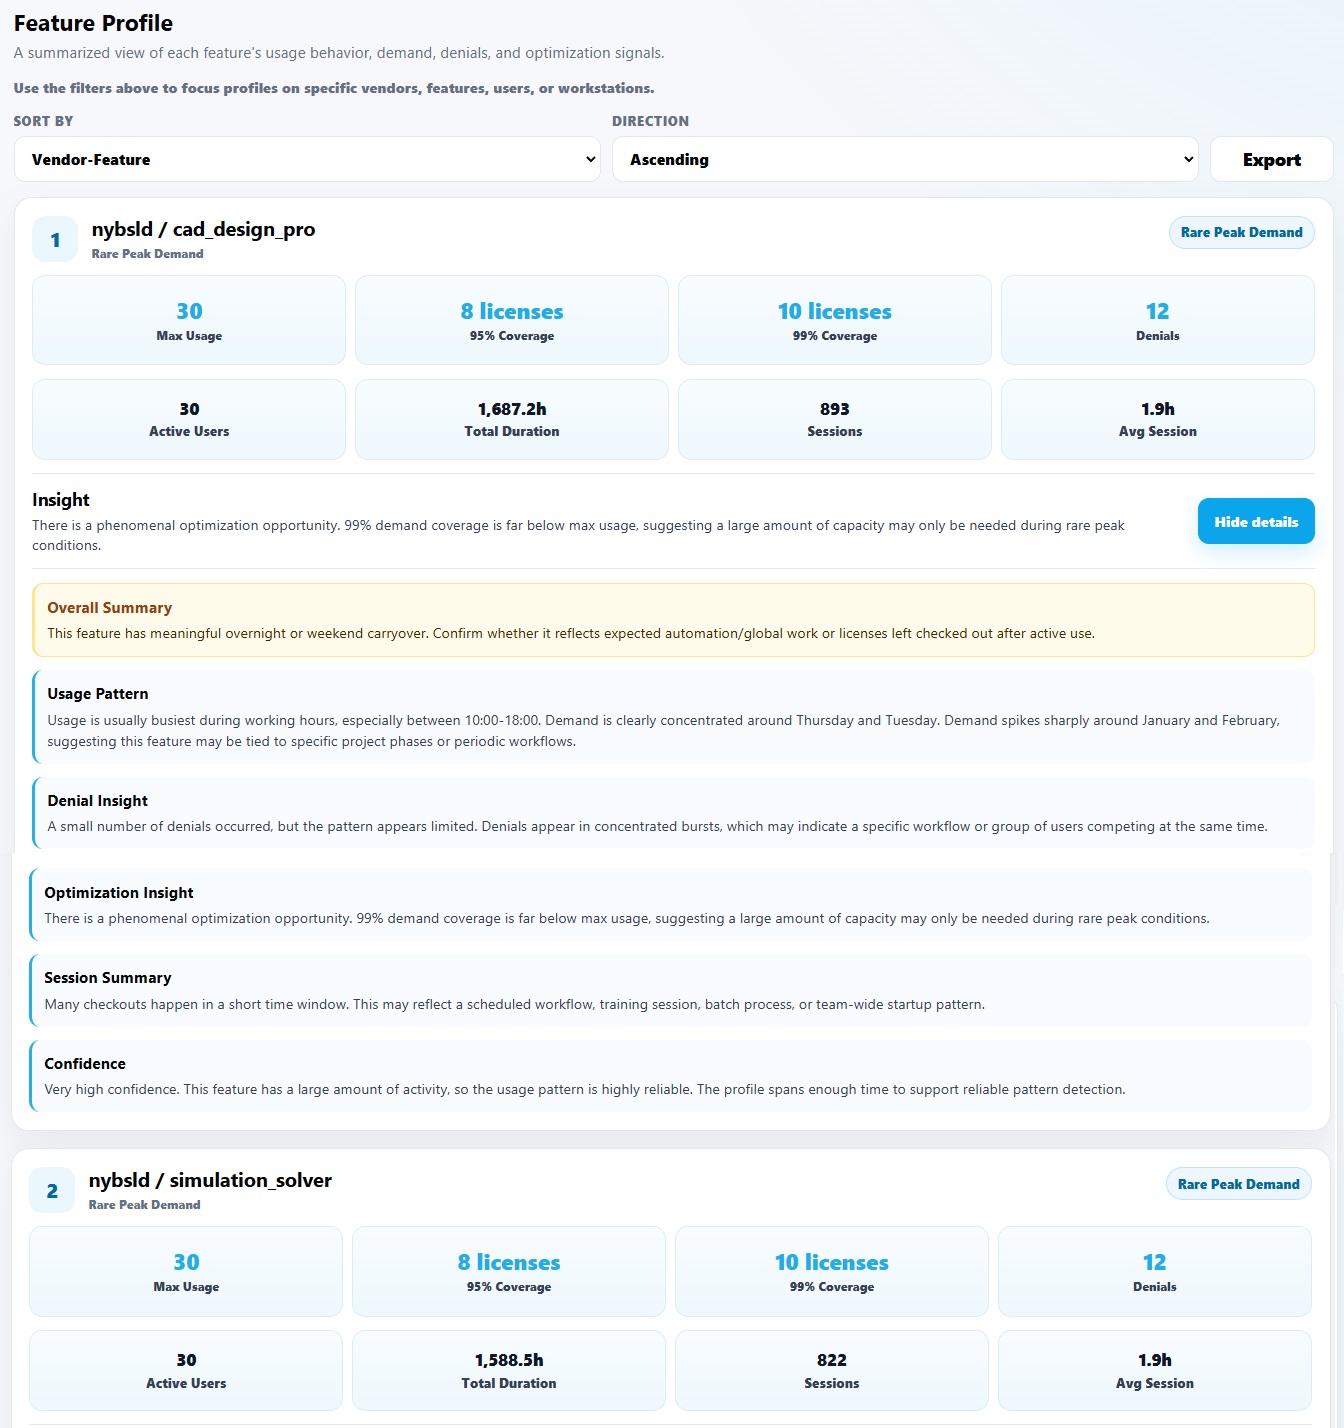
Feature Profile Report

The Feature Profile report summarizes each vendor-feature combination into a practical profile. It combines usage, sessions, denials, users, demand coverage, and written insights so each feature can be reviewed quickly.

Use this report to

  • Review one feature at a time.
  • See max usage, total duration, session count, average session length, denials, and active users.
  • Understand whether peak demand appears rare, repeated, or concentrated.
  • Review demand coverage values such as 95 percent and 99 percent coverage.
  • Find optimization, usage pattern, denial, and session insights.

Main controls

  • Sort by: Vendor-Feature, Vendor, Feature, Duration, Denials, or Max Usage.
  • Direction: Sort ascending or descending.

Interpretation tip: Use this report when you want an executive-friendly view of each feature. It is useful for preparing renewal notes, identifying features that need deeper review, and explaining license behavior without showing raw log data first.

Feature profile report showing a summarized license feature profile with usage, sessions, denials, demand coverage, and optimization insights

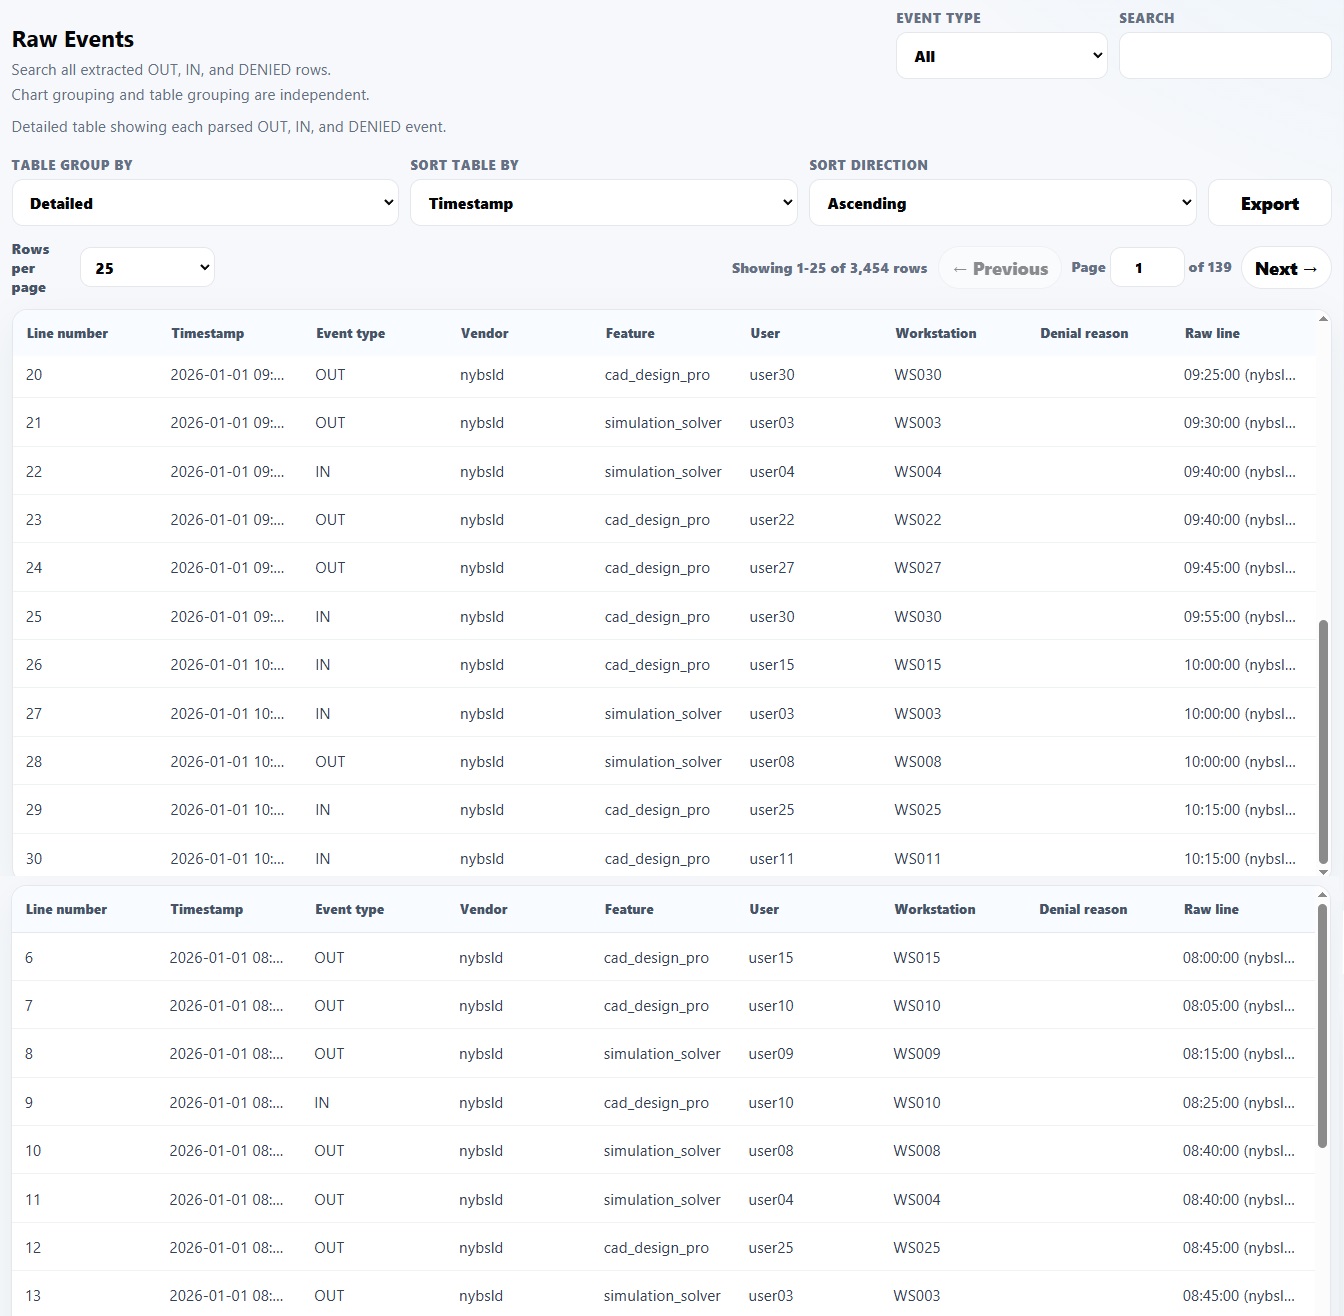
Raw Events Report

The Raw Events report shows the parsed license log events in a detailed table. It is useful for validation, troubleshooting, and checking the original event details behind the charts.

Use this report to

  • Review parsed OUT, IN, DENIED, and other event types.
  • Inspect timestamps, vendors, features, users, workstations, and denial reasons.
  • Check how specific raw log lines were interpreted.
  • Validate report findings against the underlying events.
  • Troubleshoot unusual results or parsing questions.

Interpretation tip: Use Raw Events when a chart raises a question. It lets you move from a high-level report back to the actual event records that created the result.

Raw events report showing parsed license log events in a detailed table

How to use these reports together

The reports are most useful when reviewed together. Start with the Overview report to confirm the log quality and date range. Then review Concurrent Usage for peak demand, Denials for availability problems, Usage Duration for long sessions, and Active Users for adoption. Use License Utilization and Feature Profile when preparing optimization or renewal decisions. Use the Heatmap to understand timing patterns, and Raw Events when you need to validate the underlying log records.

  1. Start with Overview to confirm the log parsed correctly.
  2. Check Concurrent Usage to understand peak demand.
  3. Review Denials to find access problems.
  4. Use Usage Duration and Active Users to understand behavior and adoption.
  5. Use License Utilization and Feature Profile for optimization and renewal planning.
  6. Use Heatmap to identify timing patterns.
  7. Use Raw Events to validate the details.

About date range filters

When a report offers date range options such as Last 7 days, Last month, Last 3 months, or Last 6 months, the range is calculated from the latest date found inside the uploaded log file. It is not based on the current calendar date.

Ready to understand your license usage?

Upload a supported log and generate practical reports.

Upload a supported license manager log and generate reports for usage, denials, active users, sessions, heatmaps, feature profiles, utilization, and raw events.